|
Relentless escalation in property taxes set to continue –
April 8, 2016 – Is the tax load fair and reasonable? Are you getting good value
for your property taxes? Are you happy as a clam about you property tax rate increases this spring?
During the past 14 years, depending on where you live in the capital region,
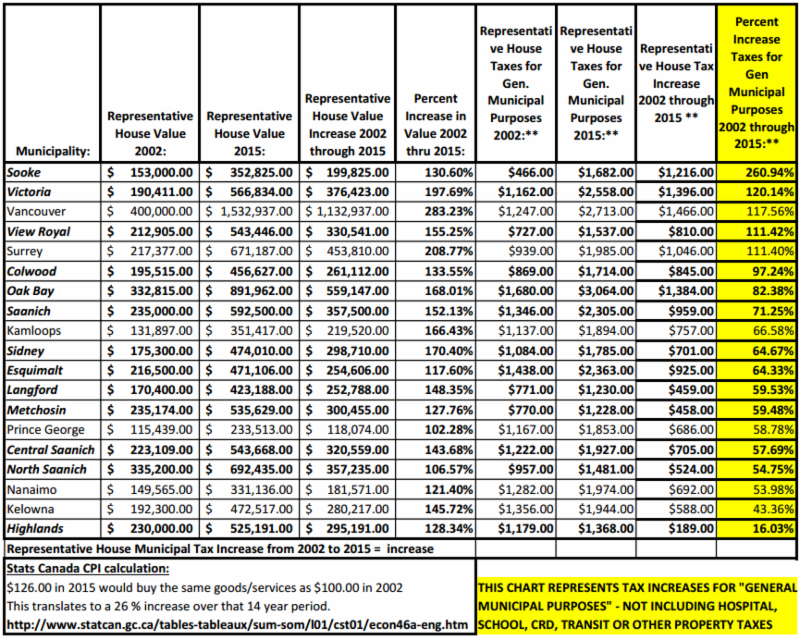
taxes for general municipal purposes increased relentlessly anywhere from
16 per cent in the Highlands, to 120 per cent in Victoria and 260 per cent in Sooke.
Tax increases for an average house across the Capital Regional District
continue to far exceed inflation. It’s a trend that will continue if municipal politicians approve tax rate increases this spring that range from two to
three to four hundred per cent more than current inflation.
Since 2002 national inflation has increased by 26 per cent, a Stats Canada calculation based on what it would cost to buy a basket of goods/services
14 years ago compared to 2015. While municipal administrators and
politicians point out they don’t buy milk or bread, the taxpayer does and
they are the ones who are able or unable to pay for administrators’ salaries
and other municipal services. CPP, OAS and many pension plans or wages
are adjusted regularly based on this number.
CLICK ON CHART TO ENLARGE >> If you’re a business the tax burden is even greater as business typically pay
a multiple of the rates paid by resident property owners. Typically business
pays a multiple between two and three, but it may go higher, as is the case
with North Saanich at 4.89 times.
What’s the evidence? Data was obtained from the Ministry of Community Sport & Cultural Development, Schedule 704, Taxes and Charges on a Representative House (see below). The figures are for property taxes for general municipal services only – taxes collected for regional, hospital & school districts and for transit are not included. General municipal taxes are the property taxes that are under the direct and total control of municipal councils. What’s an average house? A so-called representative house value (average house) is arrived at by dividing the total general municipal assessment value for land and improvements for all single-family residential subclass of properties by the number of such properties. This value is close to the ‘average value’ used by municipal authorities when they inform the public how much taxes on an ‘average house’ will increase in any particular year. How about validity? The province does a breakdown for single family homes and does not include condos (which would skew the Victoria numbers to some extent). However as far as the rate of increase for taxes, it should be similar because the same mill rate (tax rate) applies for all residential properties – the only difference would be the general increase in home values (condos versus houses) that would occur over time. If, over time, condos did not rise in value in a particular municipality as houses did, the rate of increase for condos might be lower (say for instance, it the general value of condos trended lower in relation to houses). But, the representative house taxes are still a good indicator of tax increases. Why are some tax increases so high? There are reasons why taxes in some municipalities may seem to increase by an exceptional amount. For instance, Sooke implemented secondary sewage treatment during this period on their own (with no involvement by the CRD). Alternatively, sewage treatment costs for the Peninsula municipalities was done through the CRD, hence are not reflected in their Peninsula municipal property tax bills. Central Saanich and View Royal recently built large new fire halls, which may account for increases in those two municipalities. A factor that can mitigate tax increases is a growing housing market (more new houses, with street, sewage and water infrastructure provided by developers) which can ease tax increases for all residential taxpayers. Municipalities are required to provide this tax related data to the province annually. Figures include both capital and operating costs over the 2002 to 2015 term. They are a reliable means of tracking trends of municipal (and other) property taxes. Sources:
Consumer Price Index, 1996-2015, Statistics Canada http://www.statcan.gc.ca/tables-tableaux/sum-som/l01/cst01/econ46a-eng.htm Local Government tax rates and assessments 2015, BC Ministry of Community, Sport and Cultural Development.
http://www.cscd.gov.bc.ca/lgd/infra/tax_rates/tax_rates2015.htm MEDIA CONTACTS: Stan Bartlett, Chair John Treleaven, 1st Vice-chair |


